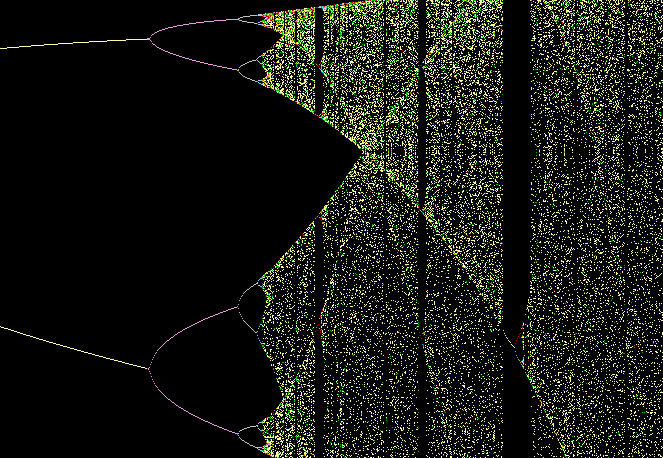
The onset of Chaos
Feigenbaum Bifurcation (fractal image created by MCM)

The onset of Chaos
Feigenbaum Bifurcation (fractal image created by MCM)
Acknowledgement: This work has been summarized using the 1987
edition—page numbers reference that edition. Quotations are for the most part taken from that work, as
are paraphrases of its commentary.
Overall impression: A good early popularization of an otherwise widely scattered and important body of knowledge. The more recent textbook Chaos and Fractals: New Frontiers of Science by by Peitgen H, Jurgens H, and Saupe D. provides more extensive details of the underlying mathematics and is ultimately more satisfying.
"Where chaos begins, classical science stops." After relativity and quantum mechanics, chaos has become the century's third great revolution in physical sciences.
Edward Lorenz (1960) creates a simple weather model in which small changes in starting conditions led to a marked ("catastrophic") changes in outcome (called "sensitive dependence on initial conditions")—i.e., the "butterfly effect" (i.e., "the notion that a butterfly stirring the air today in Peking can transform storm systems next month in New York".) Thus long-range prediction of imprecisely measured systems becomes an impossibility. He also found repetition which was never quite identical and studied non-linear systems that never attain a steady-state. Graphs of such a system (e.g., the behavior of a waterwheel) produced the Lorenz Attractor—a bounded but never-repeating pattern. He published this observation in 1963 in "Deterministic Nonperiodic Flow" (p. 114), including a 2-dimensional representation of the phase-space diagram.
Stephen Smale (1959) studies an oscillating system (incl. an der Pol's oscillator) & finds his conjecture—that systems tend to a steady state—is not valid for certain dynamical systems. He represented the systems with phase-space graphs. Topological foldings ("Smale's horseshoe") allowed graphical display of why points close together could lead to quite different outcomes (i.e., sensitive dependence on initial conditions) (p. 51).
Marcus (1985) showed a computer model of Jovian atmospheric turbulence predicts a stable coalescent oval like the red spot—"islands of structure appearing within the disorder", a self-organizing "stable chaos" (p. 56).
James Yorke (1975) studied non-linear systems including the logistic growth equation x[next]=rx(1-x). He showed that as r increases, the population equilibrium value will oscillate between two value (period=2) and that if a regular cycle of period three ever appears (for other values of r), the same system will take on regular cycles of every other period as well as completely chaotic cycles ("Period three implies chaos", 1975). Robert May, a biologist and friend of Yorke, studied this behavior in a growth model, drawing a "bifurcation" diagram (p. 71). Yorke had proved that chaos is ubiquitous. Real systems (e.g., the effects of measles inoculation on measles incidence) may show strange behavior when perturbed. Yorke gave the science of chaos its name.
Benoit Mandelbrot (1960) finds recurring patterns at every scale in data on cotton prices. He had studied transmission line noise and concluded noise was patterned like a Cantor set (p. 93), i.e., that on any scale the proportion of noise-containing periods to error-free periods was a constant. Thus errors were inevitable and must be planned for by incorporating redundancy. He described the Noah effect (in which sudden discontinuous changes can occur, e.g., in a stock's prices after bad news) and the Joseph effect (in which persistence of a value can occur for a while, yet suddenly change afterwards). He showed that a coastline's length varies with the scale of the measuring instrument, resembles itself at all scales, and is infinite in length for an infinitesimally small measuring device. Arguing that a ball of twine appears to be 1-dimensional (far), 3-dimensional (fairly near), or 1-dimensional (close), he argued that the dimensions of an object are relative to the observer and may be fractional. An object whose irregularity is constant over different scales ("self-similarity") is a fractal. For example, the Koch curve ("snowflake", p. 99, 115) is infinitely long yet encloses a finite space with dimensions = 1.2618 (other examples include the Menger sponge; and the Sierpinski gasket). His books on fractals appeared 1975, 1977. Biological systems such as the branching of the circulatory and bronchial systems proved to fit a fractal model.
The problems of studying turbulence. Lev Landau's standard text on fluid dynamics suggested a piling up of competing rhythms, a gradual buildup of complexity—but in fact chaotic complexity may appear quite suddenly. David Ruelle (1971) describes turbulent systems in phase space as varying about a "strange attractor", which attracts the orbit (only later does he learn about Lorenz' attractor). These loops and spirals in 3-dimensional phase-space were infinitely deep, never quite joining, never intersecting. The Poincaré section is a cross-section through an attractor diagram which allows display of structural details in 2-dimensions. Rössler's attractor; Hénon's attractor for globular star clusters (p. 148, 151). His attractor is created by repeated folding and stretching of phase space and appeared to be a fractal.
Mitchell Feigenbaum finds universality in period doublings despite using a variety of equations (p. 176).
Images of fractals: [Gaston] Julia sets (p. 222); the Mandelbrot set (p. 221). Hubbard shows that all points of it are connected (p. 228). Mandelbrot extends his concept of fractals to the Mandelbrot set, in which all scales have similar yet differing patterns. Barnsley develops "collage theorem" to deduce simple formula for generating complex fractal objects like ferns and forests (p. 238)...